Pseudocolor (or false color) image processing is a technique where colors are assigned to grayscale values in a monochrome image based on a specified criterion. Unlike true color images, where colors represent actual spectral information, pseudocolor assigns artificial colors to enhance the visual interpretation of grayscale images. This process is particularly useful in scientific and medical imaging, where human interpretation benefits from the ability to discern thousands of color shades, compared to the limited range of grayscale shades.
Intensity Slicing Technique
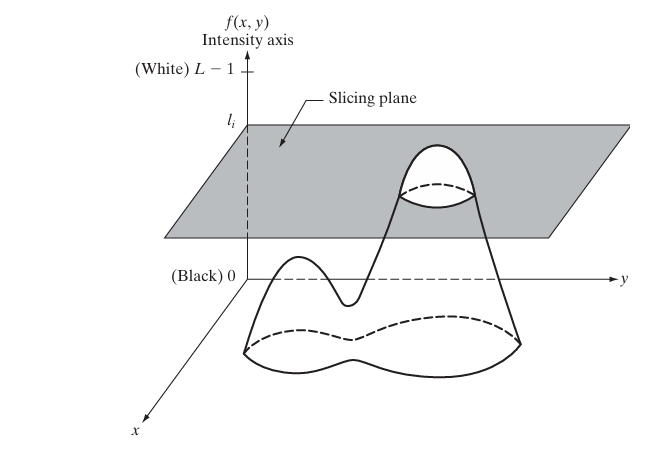
One of the simplest and most commonly used methods in pseudocolor processing is intensity slicing, also known as density slicing. The technique involves treating the grayscale image as a 3D function, where the x and y axes represent the spatial coordinates of the image, and the z-axis (intensity) represents the grayscale values. Planes are then placed at various levels along the intensity axis, slicing the function into different segments.
Geometric Interpretation
Mathematically, intensity slicing can be described as follows: Let the grayscale image be represented by a function , where is the intensity level at coordinates , with 0 representing black and representing white. If we introduce P slicing planes perpendicular to the intensity axis, at levels , then the image is divided into intensity intervals:
Each interval is assigned a specific color , so that any pixel whose intensity falls within a particular interval will be colored accordingly. For example, if a pixel at has an intensity and , then the pixel will be colored .
Example of Intensity Slicing
Consider a monochrome medical image with intensity values ranging from 0 to 255 (8-bit grayscale). We can define three slicing planes at intensity levels 85, 170, and 255, creating four intervals:
Assign colors , , and . This will result in pixels with intensity values below 85 being colored blue, pixels between 85 and 170 being colored green, and those above 170 being colored red. By adjusting the slicing planes, the image’s appearance can be modified, emphasizing different features based on intensity.

Mathematical Expression of Color Assignment
The intensity-to-color mapping is expressed as:
This process can be visualized geometrically. Figure 6.18 (hypothetical) illustrates a slicing plane at intensity level , with pixels above the plane assigned one color and those below assigned another. This results in a two-color image. By moving the slicing plane up and down along the intensity axis, the distribution of colors changes.
For a more complex example, consider defining multiple slicing planes that partition the grayscale into finer intervals. If slicing planes are defined at intensity levels , the grayscale is divided into intervals, and each interval is assigned a different color. The final image will display a variety of colors based on the intensity levels of the original grayscale image.

Example of Intensity Slicing
A practical application of intensity slicing is demonstrated with the Picker Thyroid Phantom image. Figure 6.20(a) shows the original monochrome image, which, at first glance, appears to have regions of constant intensity. However, Figure 6.20(b) reveals the result of dividing the grayscale into eight color regions. This process exposes variations in intensity that were not easily detectable in the monochrome image. For example, the left lobe, which appears as a dull gray in the original image, is shown in the color image to contain eight distinct regions, each representing a different intensity level.
In this basic example, the grayscale was divided into intervals, and each region was assigned a different color, regardless of the actual meaning of the grayscale values. The purpose was to highlight the various intensity levels. However, intensity slicing becomes even more meaningful when the subdivision of the grayscale is based on the physical properties of the image.

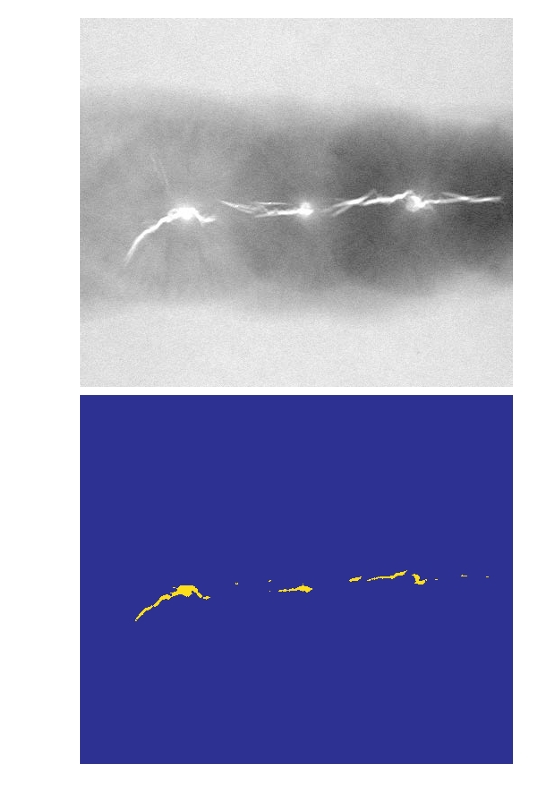
For instance, in Figure 6.21(a), an X-ray image of a weld is shown, with several cracks and porosities visible as bright white streaks. In such cases, high-intensity values (like 255 in an 8-bit image) indicate a problem, such as a crack, where the X-rays fully penetrate the material. By using intensity slicing to assign a distinct color to the intensity level of 255 and another color to all other values, as shown in Figure 6.21(b), the task of identifying defects in the weld becomes much easier for human inspectors. This method reduces error rates by enhancing the visual representation of critical intensity levels.
Intensity to Color Transformations

Functional block diagram for pseudocolor image processing.
fR, fG, and fB are fed into the corresponding red, green, and blue inputs of an RGB color monitor.
Beyond the simple intensity slicing technique, more general transformation methods provide a broader range of pseudocolor enhancement capabilities. A particularly effective approach involves performing three independent transformations on the intensity values of each pixel in the image. These transformations are then mapped into the red, green, and blue (RGB) channels of a color display. The result is a composite image where the color is controlled by the specific transformation functions applied.
Mathematical Framework
Consider an image where each pixel intensity is represented by , where , with being the maximum intensity value (e.g., for an 8-bit image). The pseudocolor transformation method involves defining three transformation functions, , , and , which map the intensity value of each pixel into the red, green, and blue channels, respectively.
For each pixel at location , the transformed RGB values are calculated as:
Here, , , and are transformation functions that can be linear or nonlinear, depending on the desired color mapping effect. These functions are applied independently to each pixel’s intensity value.
Example: Nonlinear Transformations
In contrast to the simple linear slicing technique, this approach can use nonlinear transformations, providing significant flexibility in color mapping. For example, consider applying the following transformation functions:
These transformations create a smooth variation in color as the intensity values change, with red, green, and blue channels modulated differently by the intensity. As a result, pixels with different intensity values will have a wide variety of color combinations, depending on the specific values of .
Application
This method is particularly useful when dealing with images where the intensity values correspond to physical properties, such as temperature or pressure gradients. By choosing appropriate transformation functions, the pseudocolor representation can be tailored to highlight important features in the data, making the image more interpretable for human observers.
Summary
Pseudocolor Image Processing is a technique in digital image processing where grayscale images (images with only shades of gray) are converted into color images to enhance visual interpretation. This method is particularly useful in fields like medical imaging, satellite imagery, and microscopy, where distinguishing features in grayscale images can be difficult.
Concept of Pseudocolor Image Processing
Grayscale to Color Mapping: In a grayscale image, pixel values typically range from 0 (black) to 255 (white) for 8-bit images. Pseudocolor image processing maps these pixel values to colors, improving visual distinction between different intensities. For example, a pixel value of 50 might be mapped to a shade of blue, while a pixel value of 200 might be mapped to a shade of red.
Color Look-Up Table (LUT): The process involves applying a color look-up table (LUT), which is a predefined set of colors that correspond to grayscale intensity values. The LUT assigns specific colors to specific intensity ranges. For example:
- Intensity values 0-50 → Blue
- Intensity values 51-150 → Green
- Intensity values 151-255 → Red
Color Spaces: The color in pseudocolor images is often represented in various color spaces like RGB (Red, Green, Blue) or HSI (Hue, Saturation, Intensity). The transformation from grayscale to pseudocolor can involve mapping grayscale intensity to one of these color spaces.
Mathematical Explanation
The main mathematical concept behind pseudocolor processing is the mapping function, which transforms the grayscale intensity into color values using a predefined LUT.
Let be the intensity of the pixel at location in the grayscale image. The pixel intensity value is mapped to an RGB color triplet , where:
- is the red component of the color
- is the green component
- is the blue component
The mapping is done through a function , often referred to as the color transformation function:
This transformation assigns a unique color value to each grayscale intensity based on the predefined LUT.
Example
Consider a simple 3×3 grayscale image where the pixel intensities are:
Now, assume we use the following pseudocolor LUT:
- 0-50 → Blue (RGB: [0, 0, 255])
- 51-150 → Green (RGB: [0, 255, 0])
- 151-255 → Red (RGB: [255, 0, 0])
After applying pseudocolor processing, the resulting color image will have these RGB values:
This transformation helps in identifying different intensity regions much more easily compared to the original grayscale image.
Applications
- Medical Imaging: In MRI and X-ray images, subtle intensity differences in grayscale may not be easily visible. Pseudocolor can highlight these differences to help in diagnosis.
- Satellite Imagery: Remote sensing data collected in grayscale can be colorized to make features like vegetation, water bodies, and urban areas more distinguishable.
- Thermal Imaging: Infrared (thermal) images are often shown in grayscale, but pseudocolor techniques are used to highlight temperature variations using different colors.
Advantages
- Enhanced Visualization: Pseudocolor processing improves the human ability to distinguish features in an image.
- Information Highlighting: It helps in emphasizing certain ranges of data, making it easier to detect anomalies or patterns.
Disadvantages
- Subjective Interpretation: The color mappings are arbitrary and may not correspond to any physical properties of the object being imaged, which could lead to misinterpretation.
- Limited Quantitative Use: It enhances visual perception but does not necessarily add quantitative information to the data.
References
- Gonzalez, R. C., & Woods, R. E. (2007). Digital Image Processing (3rd ed.). Pearson Education. This book provides an in-depth discussion of pseudocolor image processing and its applications.
- Pratt, W. K. (2007). Digital Image Processing: PIKS Inside (4th ed.). Wiley. This is another detailed source on image processing techniques, including pseudocolor mapping.
- Russ, J. C. (2016). The Image Processing Handbook (7th ed.). CRC Press. This reference covers various image processing techniques, including pseudocolor.
