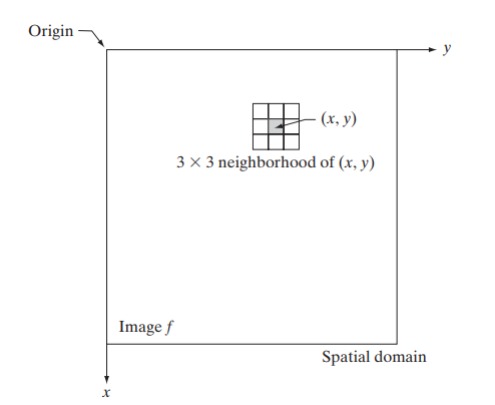
Intensity transformations are fundamental techniques in image processing, noted for their simplicity. They involve altering the pixel values of an image, denoted by ( r ) before processing and ( s ) after processing. This transformation is typically represented as ( s = T(r) ), where ( T ) is a function mapping input pixel values to output pixel values.
In digital image processing, transformation functions are often stored in a one-dimensional array, enabling efficient lookup operations. In an 8-bit environment, this array would typically contain 256 entries, each corresponding to a specific pixel value.
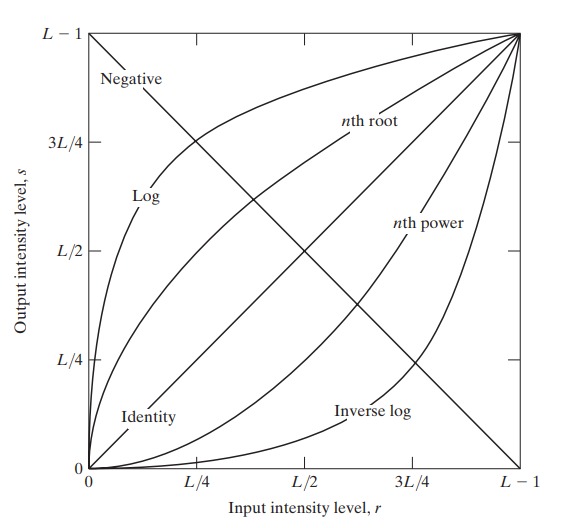
An illustrative introduction to intensity transformations is provided in Fig. 1 showcasing three primary types of functions commonly used for image enhancement:

- Linear transformations: Including negative and identity transformations. The identity function, where output intensities mirror input intensities, serves as a baseline case for comparison.
- Logarithmic transformations: Such as log and inverse-log transformations. These are useful for adjusting image contrast and brightness.
- Power-law transformations: Including nth power and nth root transformations. These functions are effective for enhancing images with varying degrees of nonlinearity.
Image Negatives
Mathematical Representation: Let’s denote the original pixel value of an image as , where and represent the spatial coordinates of the pixel. The corresponding pixel value in the negative image, denoted as , can be computed using the following formula:
Where represents the maximum intensity value in the image (255 in an 8-bit grayscale image).
Example: Consider a grayscale image with a pixel value . To compute its corresponding value in the negative image, we subtract 150 from the maximum intensity value (255):
Thus, in the negative image, the pixel at coordinates (3, 4) would have a value of 105.
Practical Applications:
Enhancement of Contrast: Image negatives can be utilized to enhance contrast in images, particularly those with low dynamic range. By inverting pixel values, details in both dark and bright regions become more pronounced, leading to a visually appealing result.
Artistic Effects: Image negatives can be employed creatively to produce artistic effects in photographs and digital artwork. The stark reversal of tones can imbue images with a surreal or dramatic aesthetic, making them stand out.
Medical Imaging: In medical imaging, image negatives can be useful for highlighting specific features or anomalies in radiographic images. By accentuating contrast, subtle details that may have been obscured in the original image can become more discernible.
Image negatives serve as a versatile tool in the arsenal of image processing techniques. Their concept is rooted in the inversion of pixel values, which can be represented mathematically using simple arithmetic operations. From enhancing contrast to fostering artistic expression, the applications of image negatives are diverse and far-reaching. Mastery of this fundamental concept empowers practitioners in the field of image processing to manipulate visual data with precision and creativity.

Log Transformations
Logarithmic transformations are a crucial tool in the realm of image processing, offering a means to enhance images with a wide dynamic range. Conceptually, a logarithmic transformation adjusts pixel values using the logarithm function, resulting in a compressed dynamic range that brings out details in both dark and bright regions. Mathematically, the transformation of a pixel intensity value to its logarithmic equivalent can be represented as , where is a constant scaling factor determined empirically or based on desired characteristics of the output image. This transformation effectively amplifies lower intensity values while compressing higher ones, leading to improved visibility of details in shadowed areas and reduced saturation in highlights. Logarithmic transformations find extensive use in medical imaging for enhancing the visualization of subtle structures in radiographic images, as well as in photography and satellite imaging for dynamic range compression and contrast enhancement. Mastering the application of logarithmic transformations empowers practitioners in image processing with a powerful tool for enhancing image quality and extracting valuable information from visual data.
Power-Law (Gamma) Transformations
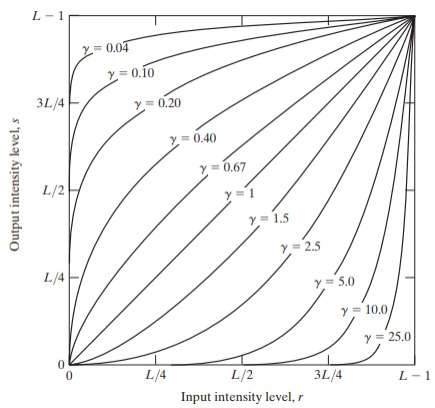
Power-law transformations, also known as gamma transformations, are a fundamental technique in image processing for adjusting the brightness and contrast of images. Conceptually, these transformations involve raising the pixel intensity values to a power, altering the distribution of brightness levels across the image. Mathematically, the transformation of a pixel intensity value to its gamma-transformed equivalent is given by , where is a constant scaling factor and is the gamma parameter, controlling the degree of transformation. When , the transformation enhances contrast by boosting the intensity of darker pixels, while compresses the dynamic range, emphasizing highlights. This versatility makes power-law transformations valuable for a range of applications, including medical imaging for enhancing tissue contrast, surveillance systems for improving visibility in low-light conditions, and digital photography for adjusting image aesthetics. Understanding and mastering power-law transformations empower image processing practitioners to manipulate brightness and contrast effectively, achieving desired visual outcomes across various domains.

Piecewise-Linear Transformation Functions
Piecewise-linear transformation functions are a type of image processing technique that involves dividing the range of pixel intensity values into segments and applying different linear transformations to each segment. Conceptually, rather than uniformly adjusting pixel values across the entire intensity range, piecewise-linear transformations allow for targeted modifications, enhancing specific features or correcting image defects. Mathematically, the transformation of a pixel intensity value to its transformed equivalent can be expressed using a set of linear equations within defined intensity intervals. For example, if the intensity range is divided into three segments, each segment might have a separate equation defining the transformation. Piecewise-linear transformations offer flexibility in image enhancement, enabling practitioners to tailor adjustments to suit specific image characteristics. Common applications include contrast stretching, histogram equalization, and dynamic range compression. Mastering piecewise-linear transformation functions empowers image processing practitioners with a versatile tool for improving image quality and extracting valuable information from visual data.
Contrast stretching
Contrast stretching is a fundamental technique in image processing used to enhance the visual quality of images by expanding the range of intensity values. This process involves mapping the original pixel intensity values of an image to a new range, thereby increasing the perceptual contrast between different parts of the image.
Here’s a detailed explanation of contrast stretching, including the mathematical concepts involved:
1. Understanding Image Intensity: In digital images, intensity refers to the brightness of a pixel, typically represented by a value ranging from 0 (black) to 255 (white) for an 8-bit grayscale image. For color images, intensity can be represented in different color channels such as Red, Green, and Blue (RGB).
2. Histogram Analysis: Before applying contrast stretching, it’s essential to analyze the histogram of the image. The histogram represents the distribution of pixel intensities. A well-distributed histogram indicates a good range of contrast, while a narrow histogram suggests low contrast.
3. Mapping Function: Contrast stretching involves applying a mapping function to transform the original intensity values of the image to a new range. This mapping function is often linear and can be represented as:
where:
- is the original intensity value of a pixel.
- and are the minimum and maximum intensity values in the original image, respectively.
- and are the desired minimum and maximum intensity values in the stretched image, respectively.
- is the new intensity value after contrast stretching.
4. Stretching Process:
- Identify Min and Max Intensity Values: Compute the minimum () and maximum () intensity values from the histogram.
- Define Desired Range: Choose the desired minimum () and maximum () intensity values for the stretched image. Typically, and for an 8-bit image.
- Apply Mapping Function: Apply the mapping function to each pixel in the image to obtain the stretched image.
5. Example: Let’s say we have an image with intensity values ranging from 50 to 200. We want to stretch the contrast such that the new minimum intensity value is 0 and the new maximum intensity value is 255.
- Using the mapping function, we calculate the new intensity values for each pixel in the image.
- For , , , and , the mapping function will scale the intensity values accordingly.
6. Result Evaluation: After contrast stretching, the histogram of the image should be spread out across the entire intensity range, resulting in improved contrast and enhanced visual appearance.
Intensity-level slicing
Intensity-level slicing, also known as gray-level slicing, is a technique used in image processing to highlight certain ranges of intensities in an image. This method can enhance specific features of an image, making them more visible, which is particularly useful in medical imaging, remote sensing, and other fields where specific intensity ranges are of interest.
Mathematical Concepts and Definitions
Intensity Levels
- Intensity Level: The brightness or darkness of a pixel in a grayscale image. In an 8-bit image, intensity levels range from 0 to 255.
- Histogram: A graphical representation of the distribution of intensity levels in an image.
Slicing Techniques
There are two primary types of intensity-level slicing:
- Binary Slicing: All pixels within a certain intensity range are set to one intensity value (often white), and all other pixels are set to another intensity value (often black).
- Multi-Level Slicing: Different intensity ranges are mapped to different intensity levels or colors.
Binary Slicing
Concept
In binary slicing, we choose a range of intensities and highlight these pixels, setting them to a high intensity (e.g., 255), while setting all other pixels to a low intensity (e.g., 0).
Mathematical Representation
Let represent the intensity of the pixel at coordinates in the original image, and let represent the intensity of the pixel in the processed image. If the intensity range to be highlighted is , the binary slicing can be mathematically expressed as:
Multi-Level Slicing
Concept
In multi-level slicing, different ranges of intensities are mapped to different output intensities or colors, allowing multiple features to be highlighted simultaneously.
Mathematical Representation
Let the intensity ranges be and the corresponding output intensities be . The multi-level slicing can be expressed as:
Applications
Medical Imaging
- CT and MRI Scans: Highlighting specific tissues or abnormalities by enhancing certain intensity ranges.
- X-ray Imaging: Enhancing bones or soft tissues by mapping specific intensity levels.
Remote Sensing
- Satellite Images: Enhancing features like water bodies, vegetation, and urban areas by selecting appropriate intensity ranges.
- Thermal Imaging: Highlighting temperature ranges to identify hot or cold areas.
Implementation Steps
- Define Intensity Ranges: Determine the intensity ranges that need to be highlighted based on the application.
- Mapping Intensities: Assign new intensity values to the defined ranges.
- Apply Transformation: Use the mathematical expressions to transform the pixel values in the image.
Practical Considerations
- Noise: Intensity-level slicing can amplify noise in certain intensity ranges. Preprocessing steps like noise reduction might be necessary.
- Dynamic Range: Ensure that the resulting image maintains sufficient dynamic range for interpretation.
- Contrast Enhancement: Combining slicing with other techniques such as histogram equalization can improve the overall contrast.
Example Code (Python)
pythonimport cv2
import numpy as np

# Load grayscale image
image = cv2.imread('image.jpg', cv2.IMREAD_GRAYSCALE)

# Define intensity ranges and corresponding output values
intensity_ranges = [(50, 100), (150, 200)]
output_values = [255, 128]

# Create output image
output_image = np.zeros_like(image)

# Apply intensity-level slicing
for (I_L, I_H), V in zip(intensity_ranges, output_values):
    mask = (image >= I_L) & (image <= I_H)
    output_image[mask] = V

# Save the result
cv2.imwrite('sliced_image.jpg', output_image)
Intensity-level slicing is a powerful technique in image processing for highlighting specific intensity ranges, enhancing features of interest, and aiding in the analysis of images across various applications. By understanding and applying the mathematical concepts and practical steps involved, this technique can be effectively utilized to improve image interpretation and analysis.
Bit-plane slicing

Bit-plane slicing is a technique in image processing where the image is decomposed into its binary bit-planes. Each bit-plane represents a specific bit of the binary representation of the pixel intensity values. This method can be used to analyze the contribution of each bit to the overall image structure and can aid in tasks like image compression and enhancement.
Mathematical Concepts and Definitions
Pixel Representation
- Pixel Intensity: In a grayscale image, each pixel intensity is typically represented by an 8-bit binary number.
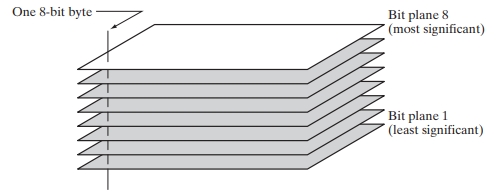
- Bit-Planes: Each bit in the binary representation of a pixel intensity forms a separate bit-plane. For an 8-bit image, there are 8 bit-planes ranging from the least significant bit (LSB, bit 0) to the most significant bit (MSB, bit 7).
Binary Representation
If a pixel at position has an intensity value , its binary representation can be written as: where is the -th bit of the binary representation.
Bit-Plane Extraction
Concept
Each bit-plane is an image that shows the contribution of the corresponding bit to the overall image. The bit-plane for the -th bit can be extracted by isolating the -th bit of each pixel’s binary representation.
Mathematical Representation
Let represent the -th bit-plane. The value of each pixel in the -th bit-plane can be obtained using a bitwise AND operation followed by a right shift:
where denotes the bitwise AND operation and denotes the left shift operation.
Example: 8-bit Image
For an 8-bit grayscale image, the pixel intensity values range from 0 to 255. Each pixel can be represented by an 8-bit binary number. The 8 bit-planes are:
- Bit-plane 0 (LSB): Captures the least significant details of the image.
- Bit-plane 1: Slightly more significant details.
- Bit-plane 2: More significant details.
- Bit-plane 3: Captures moderate details.
- Bit-plane 4: Higher significant details.
- Bit-plane 5: Even higher significant details.
- Bit-plane 6: Nearly most significant details.
- Bit-plane 7 (MSB): Captures the most significant details of the image.
Applications
Image Compression
- Bit-plane Encoding: Higher bit-planes (MSB) can be encoded with more precision, while lower bit-planes (LSB) can be compressed more aggressively or even discarded in lossy compression schemes.
Image Enhancement
- Noise Reduction: By analyzing and modifying specific bit-planes, noise in lower bit-planes can be reduced while preserving important information in higher bit-planes.
Practical Implementation Steps
- Convert Image to Binary: For each pixel, convert the intensity value to an 8-bit binary representation.
- Extract Bit-Planes: Isolate each bit-plane using bitwise operations.
- Analyze and Process: Analyze the contribution of each bit-plane and perform desired processing (e.g., compression, enhancement).
- Reconstruct Image: Combine processed bit-planes to reconstruct the image if needed.
Example Code (Python)
pythonimport cv2
import numpy as np

# Load grayscale image
image = cv2.imread('image.jpg', cv2.IMREAD_GRAYSCALE)

# Get image dimensions
rows, cols = image.shape

# Create an array to hold the bit-planes
bit_planes = np.zeros((8, rows, cols), dtype=np.uint8)

# Extract bit-planes
for i in range(8):
    bit_planes[i] = (image >> i) & 1

# Save bit-planes as separate images
for i in range(8):
    cv2.imwrite(f'bit_plane_{i}.png', bit_planes[i] * 255)
Bit-plane slicing is a valuable technique in image processing for examining and manipulating the individual bits of pixel intensities. By decomposing an image into its bit-planes, it is possible to analyze the significance of each bit, aiding in applications such as image compression and enhancement. Understanding and applying the mathematical concepts of bitwise operations are crucial for effectively utilizing this technique.
